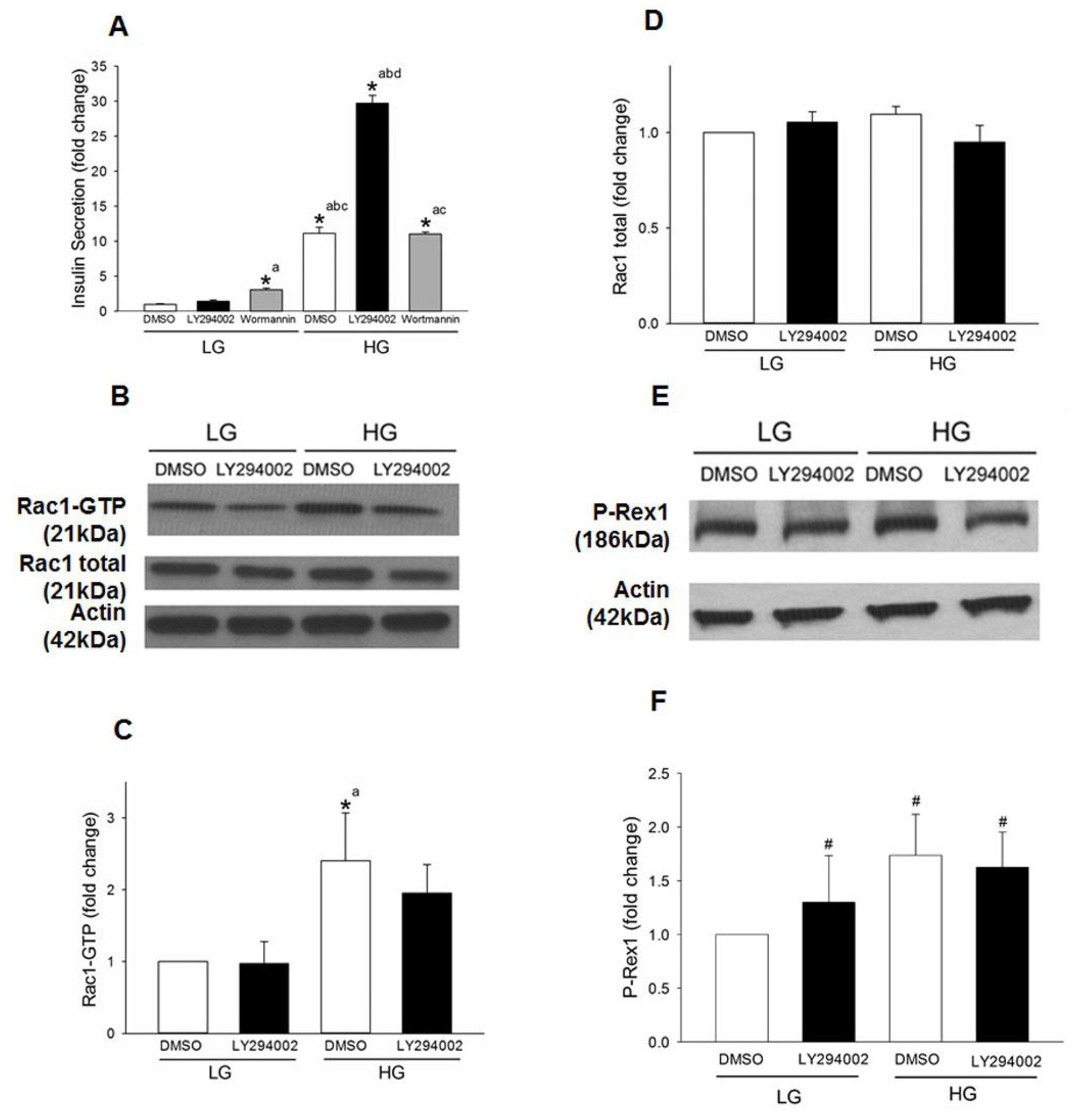
Fig. 5. LY294002, but not Wortmannin, potentiates GSIS but elicits no significant effects on glucose- induced Rac1 activation in INS‐1 832/13 cells. Panel A: INS-1 832/13 cells were treated 1hr with LY294002 (10 µM) or Wortmannin (100nM) and subjected to LG (2.5mM) or HG (20mM) treatment for 45 mins. DMSO was used as a vehicle control. Amounts of insulin secreted into the media was quantified as described under Methods. The graph is a representative experiment performed in a single run. Data are mean ± SD from four replicates and expressed as fold change relative to LG DMSO control. (* p< 0.05) Comparisons shown: a ‐ significant compared with LG DMSO control; b ‐ significant compared with LG LY294002; c- significant compared with LG Wortmannin; d- significant compared with HG DMSO control. Panel B: INS‐1 832/13 cells were treated with LY294002 (10 µM) for 1hr and subjected to LG (2.5 mM) or HG (20 mM) treatment for 15 mins. Rac1 activation was quantified by Rac1 pull down assay. Representative blots from four independent studies are provided. Panel C: Densitometry quantitation of activated Rac1 (shown in Panel B) is depicted. The results from four independent experiments presented as fold change relative to LG DMSO and as means ± SD. (* p< 0.05) Comparisons shown: a ‐ significant compared with LG‐treated DMSO control. Panel D: Densitometry quantitation of total Rac1 in Panel B is shown here. Panel E: INS-1 832/13 cells were treated with LY294002 (10 µM) for 1hr and subjected to LG (2.5mM) or HG (20mM) treatment for 15 mins. Expression of P-Rex1 in the cell lysates was detected by Western blotting. A representative blot from three independent studies is provided. Panel F: Densitometry quantitation of P-Rex1 in studies described in Panel E is shown here. # denotes not significant from LG with diluent (means ± SD; n=4 experiments).